
How to Read SDQL Betting Systems Without Fooling Yourself
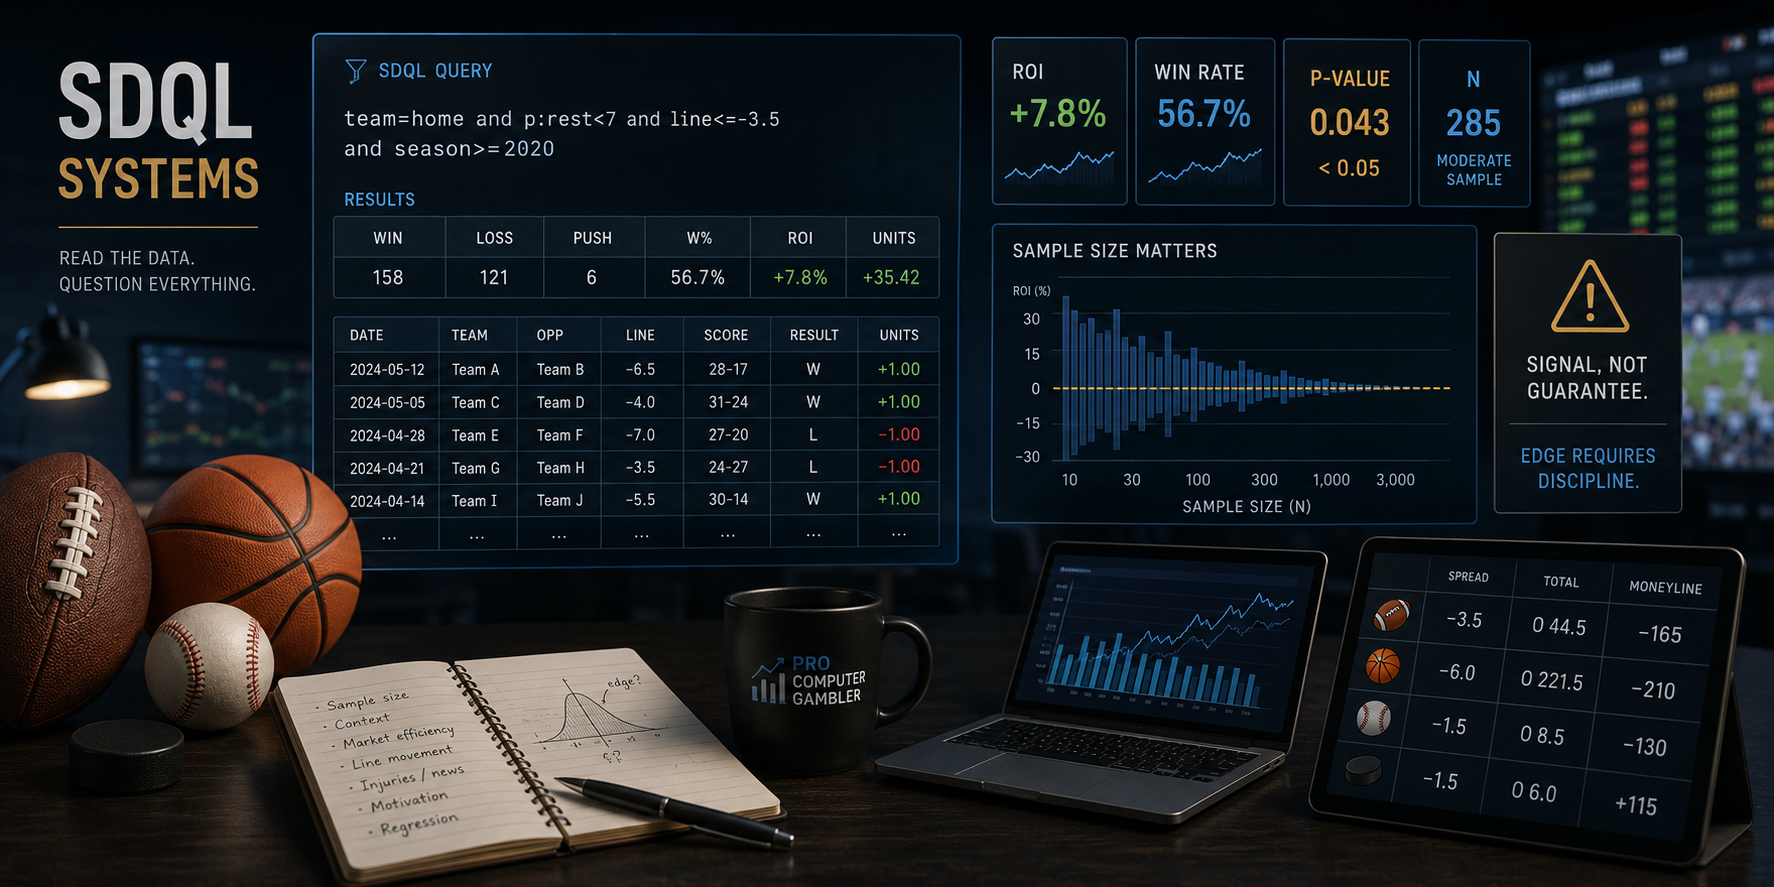
SDQL is one of the most powerful tools a sports bettor can use.
It allows you to test historical betting conditions instead of relying on opinion, memory, or narrative. You can ask questions like:
- How do teams perform after a blowout loss?
- Do road underdogs bounce back after getting embarrassed?
- Are teams overvalued after a high-scoring game?
- Does the market overreact to recent performance?
That is the good part.
The dangerous part is that SDQL also makes it very easy to fool yourself.
A historical system can look impressive. It can have thousands of games. It can have a logical story behind it. It can even show a respectable p-value.
And it can still be a bad bet.
That is the difference between finding a trend and finding market value.
This article uses a simple SDQL example — teams coming off a blowout loss — to show how bettors should read systems without turning every backtest into a betting rule.
SDQL Is a Research Tool, Not a Truth Machine
A betting system is not automatically valuable because it has a good record.
A system needs several things to matter:
- sample size,
- profitability,
- logical market explanation,
- price sensitivity,
- stability across time,
- and a reason the market may be mispricing the condition.
SDQL can help identify patterns, but it does not prove that those patterns will continue. It does not know whether a result is caused by market inefficiency, random variance, or over-filtering.
That is why a good bettor should not ask:
“Did this trend win historically?”
The better question is:
“Does this trend identify a repeatable pricing error?”
Those are very different questions.
For background on this distinction, see:
What Sports Betting Systems Really Measure
Example System: Teams Coming Off a Blowout Loss
The research example here is simple:
This means the team lost its previous game by at least 10 points.
At first glance, this sounds like a reasonable betting angle.
A bettor might think:
- the team got embarrassed,
- the market may overreact,
- public perception may turn negative,
- and the team may bounce back next game.
That is a logical story.
But logic is only the starting point. The market may already understand the story. Sportsbooks know bettors like bounce-back angles. Bettors see the same previous-game result. A blowout loss is not hidden information.
So the question becomes:
Did the market overreact enough to create value?
The answer is much more complicated.
Broad Results: The Angle Is Logical, But Not Profitable
Here are broad results for teams coming off a previous-game loss by 10+ points.
This is the first major lesson.
The idea sounds reasonable. The samples are large. But the broad results do not show a strong betting edge.
The NFL was almost perfectly balanced at 2049-2053-104 ATS.
NCAAF was slightly negative at 49.6% ATS.
NCAAB was barely above .500 at 50.2% ATS.
The NBA was the most interesting broad result at 50.8% ATS with a p-value of 0.0168, but the reported ROI was still negative.
That is exactly why SDQL requires discipline.
A system can be directionally interesting without being profitable.
The First Trap: Mistaking a Logical Story for an Edge
The “blowout loss bounce-back” idea is emotionally attractive.
Bettors like it because it feels grounded in motivation. A team was embarrassed. Coaches will make adjustments. Players will respond. The public may be too negative.
Sometimes that logic is right.
But betting markets do not pay you for telling a reasonable story. They pay you only when the price is wrong.
If the sportsbook already shades the number because it expects bounce-back money, the angle may have no value. If the public also likes the revenge or embarrassment narrative, the value may be gone before the bettor ever places the bet.
This is one of the easiest ways to misuse SDQL:
You start with a narrative, find a historical result that seems to support it, and then assume the story is predictive.
The better approach is to ask whether the result survives pricing, sample size, and market logic.
Location Split: Road Teams Look Better Than Home Teams
The next step is to split the system by location.
This is where the research becomes more interesting.
This table teaches a more advanced lesson.
The road split generally performed better than the home split.
Road teams coming off a blowout loss had better ATS results in:
- NBA,
- NFL,
- NCAAF,
- and NCAAB.
That suggests the first filter did improve the concept. The broad idea became more informative once location was added.
But notice the problem:
The road versions were still generally negative ROI.
That is the difference between improving a query and proving a betting system.
A filter can make a system look better without making it profitable.
Better Does Not Mean Good Enough
This is one of the most important rules in betting research.
A filter can improve a system from terrible to mediocre. It can improve a result from random to interesting. It can reduce losses.
But that does not mean it has cleared the threshold for actual betting value.
For example, NFL road teams off a 10+ point loss went:
956-904-43 ATS, 51.4%
That is better than random. It is also better than the home version, which went:
1080-1132-61 ATS, 48.8%
But the road version still showed a negative ROI.
That means the market may have partially mispriced the condition, but not enough to overcome the cost of betting.
This is where many bettors fool themselves. They see improvement and treat it as confirmation.
The right conclusion is more cautious:
The road split is a research lead, not a finished system.
The Home Bounce-Back Narrative Fails the Test
A lot of bettors like home teams coming off embarrassing losses.
The story is easy to understand:
- return home,
- refocus,
- respond after a bad performance,
- play better in front of the home crowd.
But the data did not support that as a universal edge.
This is a valuable result because it challenges a common betting instinct.
The market may already price home bounce-back spots. Bettors may already like them. Sportsbooks may know that a team returning home after embarrassment will attract attention.
That does not mean every home team off a blowout loss is bad. It means the broad narrative is not enough.
The system needs more work before it deserves betting consideration.
Underdogs After Blowout Losses
Another natural question is whether teams off blowout losses perform better as underdogs.
The logic is again reasonable.
If a team got blown out, the public may downgrade them. If they are now catching points, maybe the spread gives them enough room to bounce back.
The query concept:
Here are the underdog results:
This is another excellent example of how SDQL can look promising but still fall short.
NCAAB underdogs off a blowout loss went:
8505-8188-262 ATS, 50.9%
The p-value was 0.0072, which makes the result statistically interesting.
But the ROI was still negative.
This is a critical lesson:
A low p-value does not mean a profitable bet.
It means the historical result may be unusual under a random assumption. But betting is not only about being unusual. Betting is about price.
If the line does not compensate for the risk, the system can still lose money.
P-Value Does Not Replace ROI
P-value is useful, but it is often misunderstood.
A low p-value can tell us that a historical result is less likely to be random noise. But it does not tell us that:
- the system is profitable,
- the system will continue,
- the price is favorable,
- or the market inefficiency still exists.
The NCAAB underdog example is ideal:
A bettor who only looks at the p-value might think the system is strong.
A bettor who looks at ROI sees the problem.
The result may be statistically meaningful, but it did not produce a profitable betting outcome on the tested side.
That is why p-value should be treated as one piece of evidence, not the final answer.
Win Percentage and Profitability Are Not the Same Thing
Another major trap is confusing win percentage with profit.
Against the spread, a system usually needs to win meaningfully above break-even after accounting for standard pricing. In moneyline markets, the relationship is even more complicated because a lower win rate can be profitable if the odds are high enough, while a higher win rate can lose money if the price is too expensive.
Even in this blowout-loss research, several results finished above 50% ATS but still lost money.
Examples:
These are not bad research leads.
But they are not automatic betting systems.
The market price matters. If the win rate does not clear the cost of the bet, the system still loses.
That is why ProComputerGambler emphasizes price sensitivity and closing line value instead of raw win rate alone.
For more on this, see:
Closing Line Value Explained
More Filters Can Help — Or Hurt
Adding filters is not automatically wrong.
In fact, good research often requires segmentation. A broad system may hide useful subgroups. Road teams may behave differently than home teams. Underdogs may behave differently than favorites. Early season may differ from late season.
But every filter creates risk.
The more filters you add, the easier it becomes to manufacture a backtest that looks good historically but has no durable edge.
A responsible filter should have a reason.
Good filter logic sounds like this:
“Road teams off blowout losses may be undervalued because the market overreacts to the prior result and gives extra points.”
Weak filter logic sounds like this:
“The system only works on Tuesdays after two losses when the total is between 43 and 44.5.”
The first version has market logic. The second version may be overfitting.
A system should become more convincing as filters are added only if the filters make sense before seeing the result.
The Difference Between a Research Lead and a Betting System
The blowout-loss study gives us several research leads:
- Road teams off blowout losses performed better than home teams.
- Home bounce-back spots did not show broad value.
- Underdogs off blowout losses showed some statistical interest in certain sports.
- Football totals leaned mildly Under after blowout losses.
But none of those automatically becomes a finished betting system.
A research lead says:
“This condition may be worth studying further.”
A betting system says:
“This condition has enough evidence, logic, price support, and stability to deserve action.”
Those are not the same thing.
Most SDQL results should start as research leads.
Only a small number should become actionable systems.
What a Strong SDQL System Should Have
A stronger system should pass several tests.
A system does not need to be perfect across every category, but the more weaknesses it has, the more caution it deserves.
A small-sample system needs especially strong logic.
A high-win-rate system needs to prove that the price does not erase the edge.
A low-p-value system still needs to show profit.
A profitable system still needs to be checked for stability.
This is the discipline that keeps SDQL from becoming trend-chasing.
How Bettors Fool Themselves With SDQL
There are several common mistakes.
Mistake 1: Starting with the conclusion
The bettor wants a trend to be true, then keeps filtering until it appears.
Mistake 2: Ignoring price
The system wins often enough to look good but not often enough to overcome the market price.
Mistake 3: Overvaluing small samples
A 17-5 result looks powerful, but one or two outcomes can change the conclusion dramatically.
Mistake 4: Treating p-value as proof
P-value helps measure surprise. It does not guarantee profitability or future performance.
Mistake 5: Ignoring market logic
If there is no reason the sportsbook or betting public would misprice the condition, the trend may just be noise.
Mistake 6: Forgetting that the market adapts
Some historical edges disappear when information becomes widely known or pricing improves.
The purpose of SDQL is not to prove that a trend exists. The purpose is to test whether a market condition has been priced inefficiently often enough to deserve further research.
How to Read a System the PCG Way
A disciplined SDQL review should move in this order:
- Define the market idea first.
Do not start by hunting for a record. Start with a reasonable pricing theory. - Run the broad version.
See whether the basic condition has any signal. - Segment logically.
Split by home/away, favorite/underdog, season timing, price range, or total range only when the split has a market reason. - Check ROI before excitement.
A winning record is not enough. - Check p-value carefully.
Use it as context, not proof. - Look for stability.
Ask whether the pattern is consistent enough to matter. - Decide whether it is actionable or only educational.
Many systems are useful for understanding the market without being strong enough to bet blindly.
That last point is important.
A trend can improve your understanding even if it does not become an official play.
Final Takeaway
The blowout-loss example is useful because it looks like the kind of system many bettors would want to believe.
It has a logical story. It has large samples. It shows some interesting splits. Road teams performed better than home teams. Underdogs showed some statistical interest. Certain totals results leaned in a clear direction.
But the overall conclusion is more disciplined:
Teams coming off blowout losses may behave differently by location and role, but the market generally prices the obvious bounce-back narrative well enough to prevent easy profit.
That is the key lesson.
SDQL is extremely valuable when used correctly. It helps bettors test ideas, challenge assumptions, and understand how markets respond to different conditions.
But SDQL should not be used to manufacture confidence.
A good system is not just a good-looking backtest.
A good system is a historically supported market condition that survives price, sample size, logic, and stability.
That is the difference between using SDQL as research and using SDQL to fool yourself.
How This Fits Into the Market
This article is part of a larger framework for understanding how sports betting markets process price, public perception, and historical conditions.
Start here:
- Sports Betting Market Mechanics
- Public Bias and Market Distortion
- What Sports Betting Systems Really Measure
Process & Proof
ProComputerGambler focuses on structured market research, documented performance, and long-term betting discipline.
Continue with: