
MLB Run Line Trends: How Market Pricing Changes on -1, -1.5, and Underdog Run Lines
MLB run line betting looks simple on the surface.
A favorite either wins by 2+ runs or it does not. An underdog either stays within +1.5 runs or it does not. But the market underneath those outcomes is much more complicated.
The real question is not:
“Will this team win?”
The better question is:
“Is the price worth the extra margin risk?”
That is where many bettors make mistakes.
A team can be a reasonable moneyline bet and still be a poor -1.5 run line bet. An underdog can be attractive straight up but overpriced at +1.5. A home favorite can win more often than a road favorite, but still be structurally worse on the run line because it may not bat in the bottom of the ninth inning.
This article looks at MLB run line trends by moneyline range, favorite strength, home/road status, and underdog pricing. The goal is not to find a blind system. The goal is to understand how market pricing changes as the bet structure changes.
For related context, see:
Price Sensitivity in Sports Betting
What the MLB Run Line Actually Changes
A moneyline bet asks one question:
Did the team win the game?
A -1.5 run line bet asks a stricter question:
Did the team win by at least 2 runs?
That one extra run changes everything.
A favorite can win straight up but fail on -1.5. In baseball, that matters because one-run games are common. Bullpen usage, ninth-inning strategy, extra innings, home-team walk-offs, and late-game run prevention all affect margin.
For favorites, the -1.5 run line usually offers a better payout than the moneyline, but it comes with one major penalty:
You lose every favorite win by exactly one run.
For underdogs, +1.5 gives protection, but the market charges for that protection through a worse price.
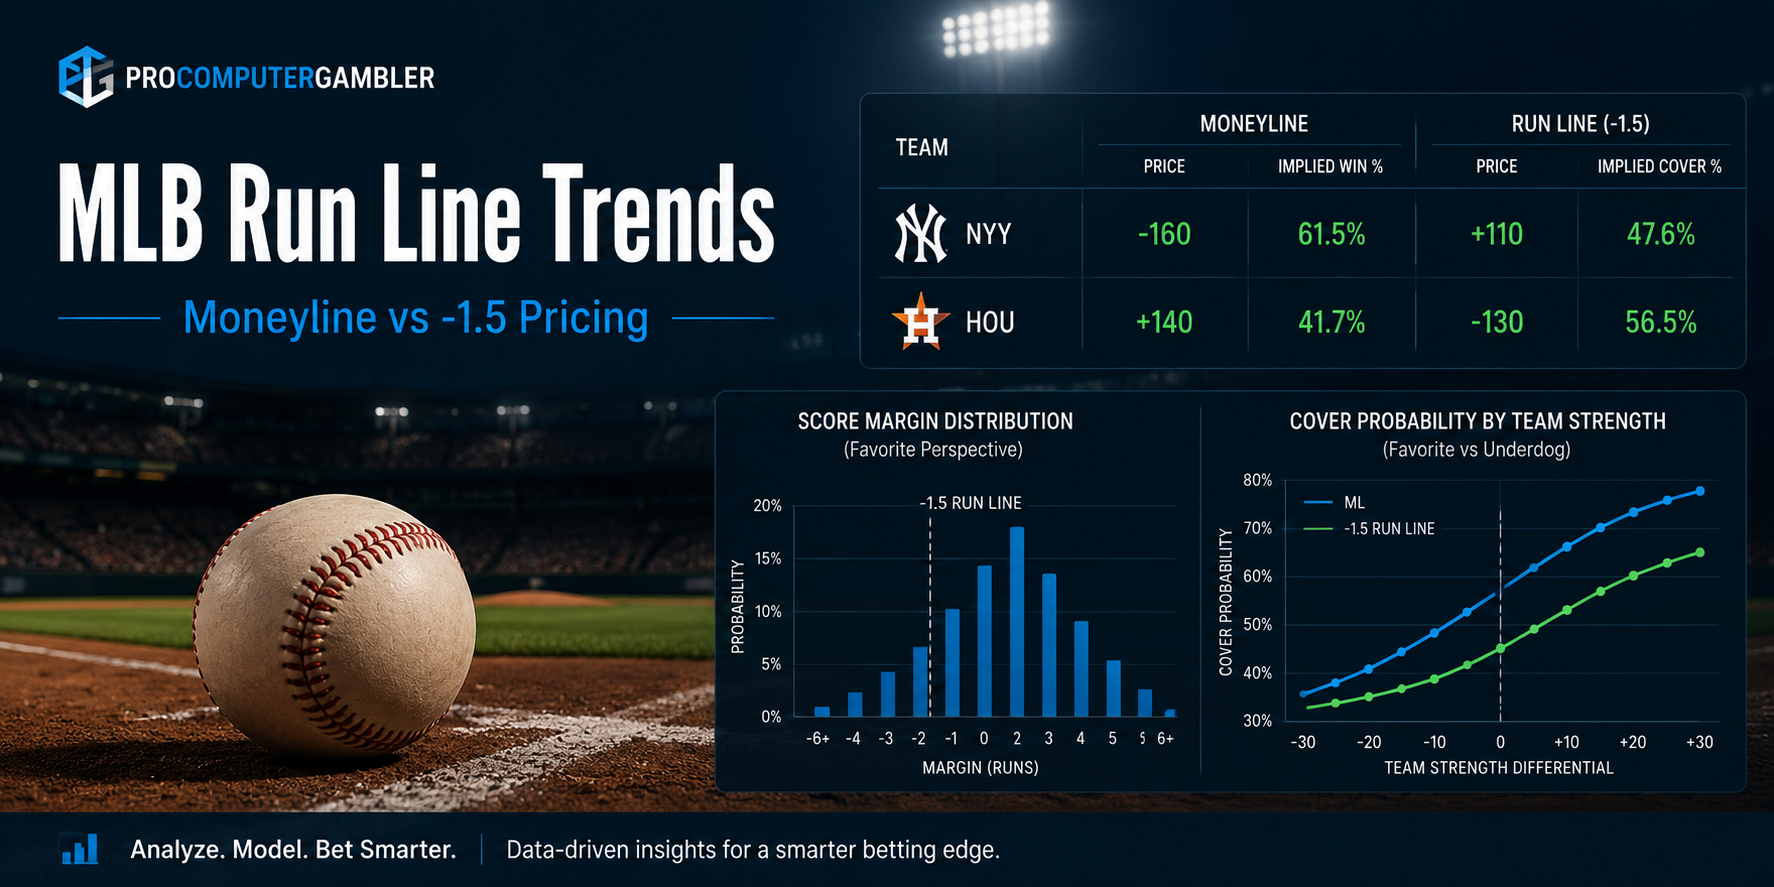
That is why run line analysis has to focus on margin distribution, not just win percentage.
Favorite Moneyline Price vs -1.5 Run Line Results
The first table breaks MLB favorites into moneyline price ranges.
This table shows the core run line problem.
Cheap and mid-priced favorites win games, but they do not win by margin often enough to automatically justify laying -1.5.
At -110 to -130, favorites won straight up 52.9% of the time, but covered -1.5 only 39.0% of the time. The -1.5 ROI was worse than the moneyline ROI.
At -151 to -180, favorites won 61.1% straight up, but still covered -1.5 only 44.2% of the time. The favorite won by exactly one run 16.9% of the time.
That one-run result is the danger zone.
A bettor who lays -1.5 has to be right about the favorite and right about the margin.
That is a much higher standard.
When Does -1.5 Become More Viable?
The -1.5 run line does not start looking historically attractive until the favorite becomes very expensive on the moneyline.
At -221 to -260, favorites won:
- 71.9% straight up
- 55.1% on -1.5
- with +1.8% moneyline ROI
- and +1.1% -1.5 ROI
At -261 or higher, favorites won:
- 75.8% straight up
- 60.9% on -1.5
- with +0.7% moneyline ROI
- and +2.5% -1.5 ROI
That does not mean every large favorite should be played on the run line.
But it does show that margin strength finally begins to matter once the favorite is dominant enough. The market still charges for that strength, but the probability of a multi-run win becomes much more realistic.
The key lesson:
The -1.5 run line is usually not a shortcut around expensive moneyline pricing. It only becomes useful when the team’s margin profile is strong enough to justify the added risk.
This is why price sensitivity matters. A bet can look attractive at one number and become poor at another.
The One-Run Win Problem
Across favorite ranges, one-run wins were consistently meaningful.
This is the part of run line betting that casual bettors underestimate.
Even strong favorites still win by exactly one run often enough to damage -1.5 value. The market knows this. That is why -1.5 payouts may look tempting but are not automatically mispriced.
A favorite winning by one run is not a rare fluke. It is a normal part of MLB margin distribution.
That is why a disciplined bettor has to ask:
“Am I being paid enough to give away the one-run win?”
Most of the time, the answer is not obvious.
Home Favorites vs Road Favorites
The home/road split is one of the most important run line concepts in baseball.
Home favorites won more often straight up:
59.0% vs 56.5%
But road favorites covered -1.5 more often:
45.4% vs 41.7%
That is a major structural difference.
Why?
Because home teams do not bat in the bottom of the ninth when they are already leading. A home favorite that leads by one after the top of the ninth wins the game, but it never gets another offensive chance to extend the margin.
Road favorites do not have that same limitation. If a road favorite is leading after eight innings, it still bats in the top of the ninth. That creates additional opportunity to turn a one-run lead into a multi-run win.
This does not mean road favorites are automatically good run line bets.
But it does mean the structure of the game matters.
The lesson:
Home favorites may be stronger moneyline teams, but road favorites can be structurally more run-line friendly because they receive a full ninth-inning scoring path.
That is one of the clearest examples of why run line betting cannot be evaluated only by team strength.
Why Home Favorites Can Be Traps on -1.5
Home favorites attract bettors because they feel safer.
They are at home. They are favored. They often have better starting pitching or stronger overall team quality.
But the -1.5 run line changes the bet.
The issue is not whether the home favorite is likely to win. The issue is whether it is likely to win by enough.
Home favorites in this sample won straight up 59.0% of the time, but covered -1.5 only 41.7% of the time.
That gap is enormous.
The favorite may be the right side, but the run line may be the wrong structure.
This is why ProComputerGambler separates market analysis from simple pick logic. A team can be attractive in one market and unattractive in another.
For related reading, see:
Key Numbers and Half-Points
Underdog +1.5 Results by Price Range
The other side of run line betting is underdog protection.
A +1.5 underdog bet does not require the dog to win outright. It only requires the underdog to win or lose by exactly one run.
That protection has value, but the market charges for it.
The underdog table shows a similar idea from the opposite side.
The +1.5 cover rate is much higher than the moneyline win rate, but the ROI is still generally negative.
That means the safety is real, but not free.
For example, underdogs from +100 to +120 won outright 46.8% of the time and covered +1.5 61.1% of the time. That extra protection was meaningful. But the +1.5 ROI was still -1.9%.
From +141 to +160, underdogs won outright 39.4% and covered +1.5 55.9%, but the +1.5 ROI remained negative at -2.7%.
At +181 and higher, the +1.5 cover rate dropped to 44.7%, and the ROI was deeply negative.
The lesson:
Underdog +1.5 protection has value, but the market often prices that protection efficiently.
A bettor should not assume +1.5 is conservative just because it covers more often. A bet can win more often and still be a poor price.
Underdog +1.5 Is Not Automatically Safer
Many bettors view +1.5 as the “safer” way to bet an underdog.
That is only partly true.
It is safer in terms of win percentage. It is not automatically safer in terms of expected value.
The market knows that one-run games are common. It also knows that +1.5 protection attracts bettors who want emotional comfort. That can make the price expensive.
A +1.5 bet can be correct when:
- the underdog has a realistic chance to win outright,
- the game environment supports a tight margin,
- the price is not overinflated,
- and the moneyline alternative is not clearly superior.
But blindly buying +1.5 because it “feels safer” is not a professional process.
The correct question is:
“How much am I paying for the extra run and a half?”
That is a pricing question, not a prediction question.
What About Total Ranges?
The total-range results were less useful than the favorite and underdog price splits.
Broad totals buckets showed that run line results remained close to balanced overall, with run line outcomes near the high-40s across large samples. That suggests the scoring environment matters, but broad total ranges alone may not be enough.
That makes sense.
A game total can influence margin distribution, but it does not operate by itself. It interacts with:
- favorite price,
- home/road status,
- bullpen strength,
- park factor,
- starting pitcher quality,
- team offensive profile,
- and late-game leverage.
A low total may increase the value of +1.5 in some spots, but if the market charges too much for that protection, the edge disappears.
A high total may create more room for a favorite to win by multiple runs, but it may also increase volatility for both sides.
The better future study is not simply:
“Do high totals favor -1.5?”
The better question is:
“Which favorite price ranges and home/road splits become more profitable when combined with specific total ranges?”
That is where the next layer of run line research should go.
Why the -1 Run Line Deserves Attention
The standard MLB run line is -1.5, but many bettors also use a -1 structure.
The -1 line is a compromise between the moneyline and -1.5.
It usually offers:
- better payout than the moneyline,
- less downside than -1.5,
- and partial protection when the favorite wins by exactly one run, depending on how the bet is structured.
This matters because the data shows one-run favorite wins are common.
If a favorite wins by exactly one run roughly 14–17% of the time across many price ranges, then the -1 structure can be useful in certain spots. It does not eliminate risk, but it changes the risk profile.
That is especially relevant when the favorite is strong enough to win frequently but not strong enough to justify the full -1.5.
For related tool usage, see:
Run Line Calculator
Practical Run Line Framework
Based on this research, here is a simple way to think about MLB run line decisions.
This framework is more useful than asking whether run lines are “good” or “bad.”
Run lines are not good or bad in isolation.
They are pricing instruments.
The same game can produce different value depending on whether the bet is:
- moneyline,
- -1,
- -1.5,
- +1.5,
- or passed entirely.
Main Takeaways
The data supports several important conclusions.
First, cheap favorites are usually poor -1.5 candidates. They do not win by margin often enough to overcome the added risk.
Second, one-run wins are a real structural problem. Across favorite price ranges, favorites won by exactly one run often enough to make -1.5 dangerous.
Third, very large favorites are where -1.5 becomes more historically viable. Once the favorite becomes strong enough, the chance of a multi-run win improves meaningfully.
Fourth, road favorites are more run-line friendly than home favorites. Home favorites win more often straight up, but road favorites cover -1.5 more often because they still bat in the ninth inning.
Fifth, underdog +1.5 protection is real but often expensive. Higher cover rates do not automatically mean better betting value.
The biggest lesson is simple:
MLB run line value depends on price, margin distribution, and game structure. It is not enough to like the team. You have to like the bet type.
That is the difference between betting a side and analyzing a market.
How This Fits Into the Market
This article is part of a larger framework for understanding how sports betting markets process price, risk, and public perception.
Start here:
- Sports Betting Market Mechanics
- Public Bias and Market Distortion
- What Sports Betting Systems Really Measure
Process & Proof
ProComputerGambler focuses on structured market research, documented performance, and long-term betting discipline.
Continue with: