
MLB SDQL Under Betting Systems: Early Starts, Prior Unders, and Series Suppression
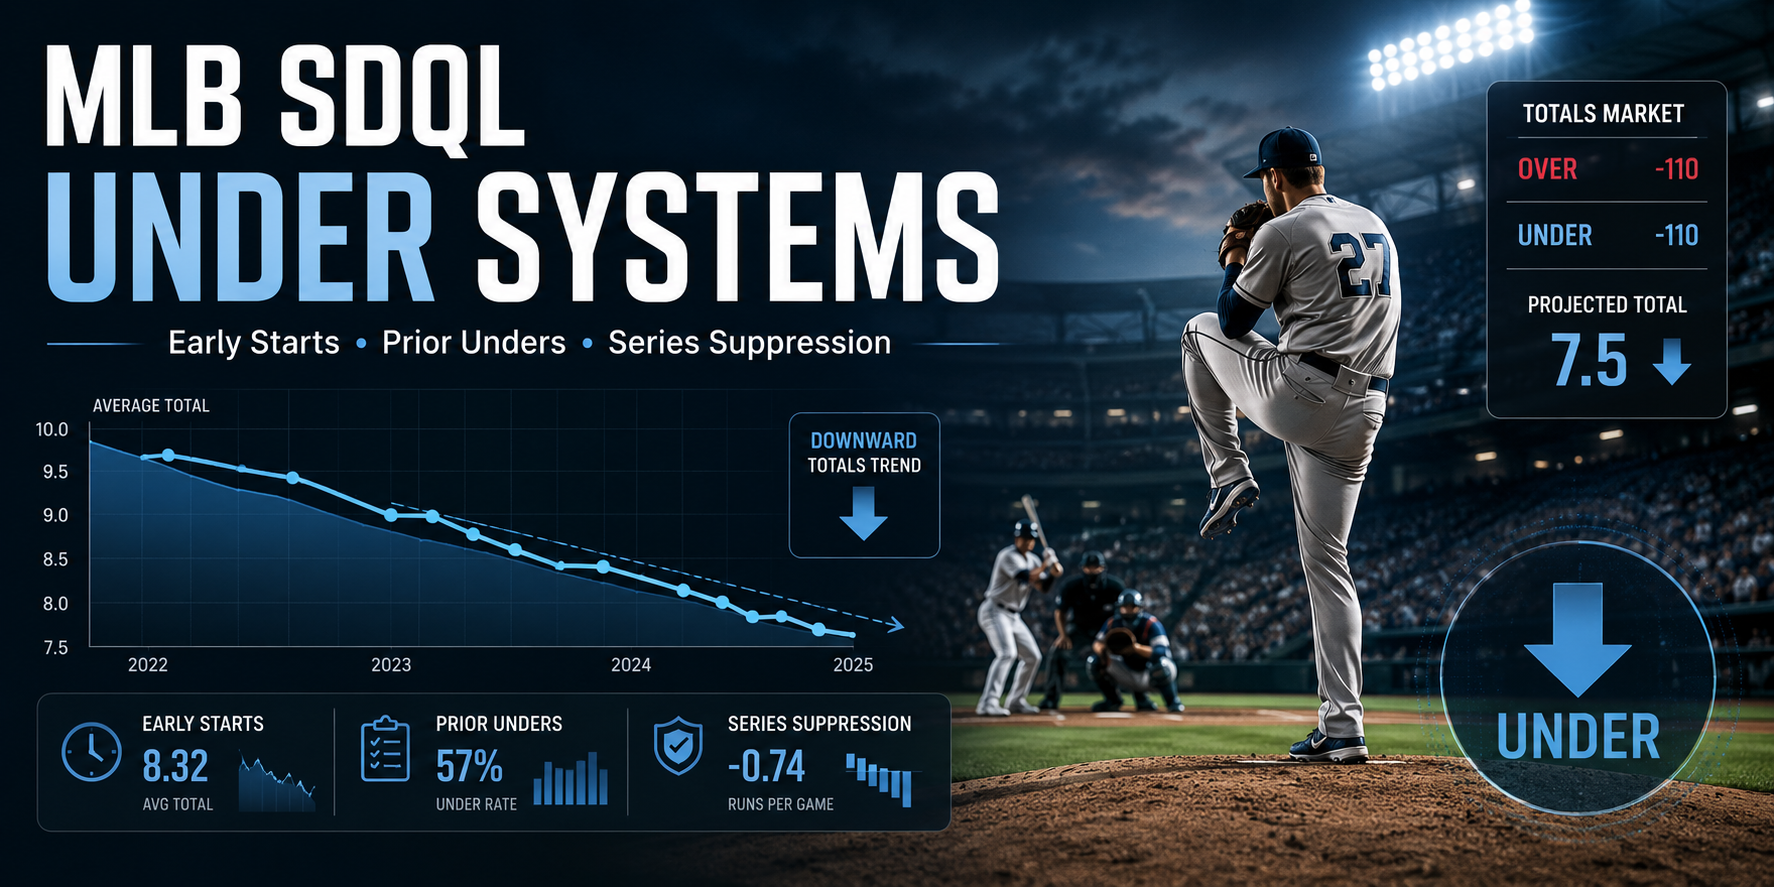
These MLB SDQL Under betting systems focus on games where recent pitching context, low earned-run allowance, early start time, prior Under results, and later-series conditions point toward suppressed scoring. The goal is not to chase one isolated stat. The goal is to document repeatable market conditions where historical totals have stayed lower than the market expected.
What Are These MLB SDQL Under Systems Measuring?
These MLB SDQL Under systems measure situations where run scoring may be suppressed by recent pitching efficiency, lower offensive output, prior Under continuation, or series-stage conditions. Each system isolates a different path toward the same market result: the total staying Under.
The three systems covered here are:
| System | Main Signal | Best Market |
|---|---|---|
| Early start + low starter pitch count | Controlled starter matchup / daytime context | Under |
| Opponent allowed fewer than 2 earned runs + prior Under | Prior run suppression continuation | Under |
| Game 3+ of series + limited tied innings in starter’s last outing | Later-series scoring suppression | Under |
Because the SDQL output lists the OU result from the Over side, the Under-side record is the reverse of the listed OU record.
MLB SDQL Under System: Early Starts, Low Earned Runs, and Lower Starter Pitch Count
This system looks at games since 2022 where the team allowed no more than 4 earned runs in the starter’s last matchup, the current game starts before 1420 in SDQL time format, and the starter threw fewer than 92 pitches in that previous matchup.
SDQL Code
season>=2022 and S:earned runs<=4 and start time<1420 and S:starter pitches thrown<92
Plain-English Description
Take the Under when:
- The season is 2022 or later
- The team had no more than 4 earned runs allowed in the starter’s last matchup
- The current game start time is before 1420
- The starter threw fewer than 92 pitches in the starter’s last matchup
This is a controlled-run-environment system. It combines recent starter matchup efficiency, a lower pitch-count threshold, and an earlier game-time condition.
Historical Results
| Market | Record | Avg Cover Margin | Win % | ROI | Profit | P-Value |
|---|---|---|---|---|---|---|
| SU | 245-256 | -0.1 | 48.9% | -7.6% / -0.5% | -$4,949 / -$278 | 0.32770732 |
| RL | 230-270-0 | -0.4 | 46.0% | -10.7% / -3.5% | -$6,927 / -$2,272 | 0.04053670 |
| OU | 191-292-17 | -0.2 | 39.5% Over | -23.7% / +15.1% | -$13,060 / +$8,268 | 0.00000249 |
Average Line: -118.6 / -105.6
Average Run Line: -111.1 / -113.7
Average Total: 8.4
Why This MLB SDQL Under Betting System Matters
This is the strongest Under system in this group from an ROI standpoint.
The Over side went 191-292-17, which implies the Under side went 292-191-17. Excluding pushes, that is roughly a 60.5% Under rate.
The reported Under-side ROI is +15.1%, with a profit of +$8,268 and a very low p-value. That makes this a strong historical totals filter.
The side and run line results are weak, which is important. This system is not saying the team itself is worth betting. The value appears specifically on the total.
The market logic is that recent starter matchup control, limited earned-run damage, and a sub-92 pitch workload may point toward a lower-scoring environment than the total fully reflects.
MLB SDQL Under System: Opponent Allowed Fewer Than 2 Earned Runs and Prior Game Went Under
This system looks at games since 2024 where the opponent allowed fewer than 2 earned runs in its previous game, the current series has fewer than 4 games, and the team’s last game went Under the total.
SDQL Code
season>=2024 and op:earned runs<2 and series games<4 and p:U
Plain-English Description
Take the Under when:
- The season is 2024 or later
- The opponent allowed fewer than 2 earned runs in its previous game
- The series has fewer than 4 games
- The team’s previous game went Under the total
This is a prior-suppression continuation angle. It looks for games where recent run prevention was already strong and the previous game already stayed below the total.
Historical Results
| Market | Record | Avg Cover Margin | Win % | ROI | Profit | P-Value |
|---|---|---|---|---|---|---|
| SU | 654-674 | -0.1 | 49.2% | -3.4% / -4.6% | -$5,641 / -$8,135 | 0.30111604 |
| RL | 665-662-0 | -0.1 | 50.1% | -4.0% / -9.0% | -$6,836 / -$15,607 | 0.47819950 |
| OU | 561-722-44 | 0.0 | 43.7% Over | -15.9% / +7.6% | -$23,243 / +$11,032 | 0.00000387 |
Average Line: -105.2 / -119.9
Average Run Line: -111.7 / -112.9
Average Total: 8.2
Why This Prior-Under System Matters
The Over side went 561-722-44, which implies the Under side went 722-561-44. Excluding pushes, that is roughly a 56.3% Under rate.
The reported Under-side ROI is +7.6%, with a profit of +$11,032.
This is a newer sample because it begins in 2024, but the sample size is already large enough to take seriously as a watchlist condition. The key is that this system is not just looking at one low-scoring game. It combines prior Under context with an opponent that recently allowed fewer than 2 earned runs.
That matters because the market may not always lower the next total enough after a low-scoring result, especially when bettors expect normal offensive regression.
MLB SDQL Under System: Game 3 or Later of Series With Limited Tied-Inning Context
This system looks at games since 2017 where the previous game was in the Central time zone, the current matchup is at least game 3 of the series, and the starter’s last outing had innings tied less than or equal to 6.
SDQL Code
season>=2017 and p:time zone=’C’ and series game>=3 and s:innings tied<=6
Plain-English Description
Take the Under when:
- The season is 2017 or later
- The previous game was in the Central time zone
- The current matchup is at least game 3 of the series
- The starter’s last outing had innings tied less than or equal to 6
This is a larger-sample series-context Under system. It looks for later-series games where the prior starter context and game environment have historically leaned lower scoring.
Historical Results
| Market | Record | Avg Cover Margin | Win % | ROI | Profit | P-Value |
|---|---|---|---|---|---|---|
| SU | 1792-1875 | 0.0 | 48.9% | -5.5% / -0.0% | -$26,321 / -$163 | 0.08785034 |
| RL | 1782-1879-0 | -0.1 | 48.7% | -5.8% / -3.1% | -$26,731 / -$14,663 | 0.05629765 |
| OU | 1579-1905-177 | +0.2 | 45.3% Over | -12.7% / +4.6% | -$50,948 / +$18,372 | 0.00000002 |
Average Line: -111.0 / -107.6
Average Run Line: -110.4 / -111.2
Average Total: 8.6
Why This Later-Series Under System Matters
This is the largest sample in the group.
The Over side went 1579-1905-177, which implies the Under side went 1905-1579-177. Excluding pushes, that is roughly a 54.7% Under rate.
The Under-side ROI is lower than the first two systems at +4.6%, but the profit is larger at +$18,372 because of the bigger sample.
The value here is not as explosive as the early-start system, but it is broader. Later-series MLB games can have different scoring dynamics than series openers. Teams have already seen bullpens, lineup decisions may be more informed, and the market may still price the total too close to a generic scoring baseline.
The side and run line results again do not show attractive value. The edge is in the total.
Which MLB Under System Looks Strongest?
The strongest system depends on whether you prioritize ROI, recency, or sample size. All three point toward the Under, but the first system is the cleanest from a profitability standpoint.
| Rank | System | Implied Under Record | Under ROI | Best Use |
|---|---|---|---|---|
| 1 | Early start + low earned runs + lower starter pitch count | 292-191-17 | +15.1% | Highest ROI and strongest Under rate |
| 2 | Opponent allowed fewer than 2 earned runs + prior Under | 722-561-44 | +7.6% | Strong recent continuation signal |
| 3 | Game 3+ of series + limited tied innings | 1905-1579-177 | +4.6% | Largest sample and broadest filter |
The first system is the best candidate for a priority watchlist because it combines strong ROI, strong Under rate, and a meaningful sample.
The second system is useful because it is more recent and still has a large sample.
The third system is the broadest. It may be better used as a supporting market-context filter rather than a standalone trigger.
What These MLB Under Systems Say About Totals Markets
These MLB Under systems suggest that totals markets can remain too high when recent run suppression is specific but not obvious enough to dominate public perception.
The strongest recurring signals are:
- Recent earned-run control
- Previous game stayed Under
- Earlier game-time context
- Lower starter pitch count
- Later-series conditions
- Average totals still in the 8.2 to 8.6 range
That last point is important. These are not only extremely low totals where the market is already pricing a pitching duel. These systems occurred around average totals of 8.2, 8.4, and 8.6, which suggests there may still have been room for the market to adjust downward.
How Should Bettors Use These MLB SDQL Under Systems?
These MLB SDQL Under systems should be used as research filters, not automatic betting picks. They identify games worth investigating further, but the final decision should depend on current price, line movement, weather, park factors, bullpen availability, and starting pitcher confirmation.
Before using one of these Under systems, check:
- Has the total already dropped?
- Is the current number still close to the historical average total?
- Are the starting pitchers confirmed?
- Are key relievers available?
- Is the weather helping or hurting scoring?
- Is the park neutral, hitter-friendly, or pitcher-friendly?
- Did the previous Under happen because of repeatable factors or random sequencing?
- Is the current market already accounting for the same information?
The best historical Under system can lose value if the total has already moved too far. A system that performed well around 8.4 may not offer the same value if the current market has already dropped to 7.0 or 7.5.
Key Takeaways From These MLB SDQL Under Betting Systems
These three systems all reinforce the same idea: MLB totals value often appears when the market does not fully price run suppression.
The major takeaways are:
- The strongest ROI came from the early-start, low-earned-runs, low-pitch-count system.
- The 2024+ prior-Under continuation system has a strong sample for a recent trend.
- The later-series system has the largest sample and the biggest Under-side profit.
- The side and run line results are not the primary signal.
- The Under results are the consistent finding across all three systems.
The purpose of these trends is not to predict a single game perfectly. The purpose is to identify historical market conditions where the total has been too high often enough to deserve serious attention.
How This Fits Into the Market
Sports Betting Market Mechanics
A broader explanation of how pricing, line movement, market timing, and betting value interact across major sports markets.
Public Bias and Market Distortion
Why public perception can push markets away from fair value, especially when bettors overreact to recent scoring results.
What Sports Betting Systems Really Measure
A deeper look at why betting systems should be viewed as structured market filters, not guaranteed predictions.
Process & Proof
Documented Betting Results
Long-term betting performance matters more than isolated wins, short streaks, or one-day results.
Raw Numbers
Daily market numbers and betting data help turn historical research into a more structured decision-making process.
Related MLB Analysis
MLB Trends
A hub for MLB betting trends, market research, and historical system analysis.
MLB Team Trends
Team-specific MLB trend research for bettors who want to study historical conditions beyond basic standings and recent form.
What Are Good General Backtesting Filters?
A practical guide to sample size, p-values, ROI, and avoiding misleading historical betting systems.
Good trend. I like how this looks at timing and schedule context, not just pitchers and lineups.
The early start angle is interesting. Day games can create a different scoring environment than standard night games.
Useful post. MLB totals are noisy, so having a structured system helps separate real conditions from one-game randomness.
Nice SDQL example. It shows how small situational details can matter when they are tested across a larger sample.
Good SDQL breakdown. I like that the Under logic is tied to offensive profile instead of just recent final scores.