
MLB SDQL Under Betting Systems: Low Offense, Road Dogs, and Suppressed Total Environments
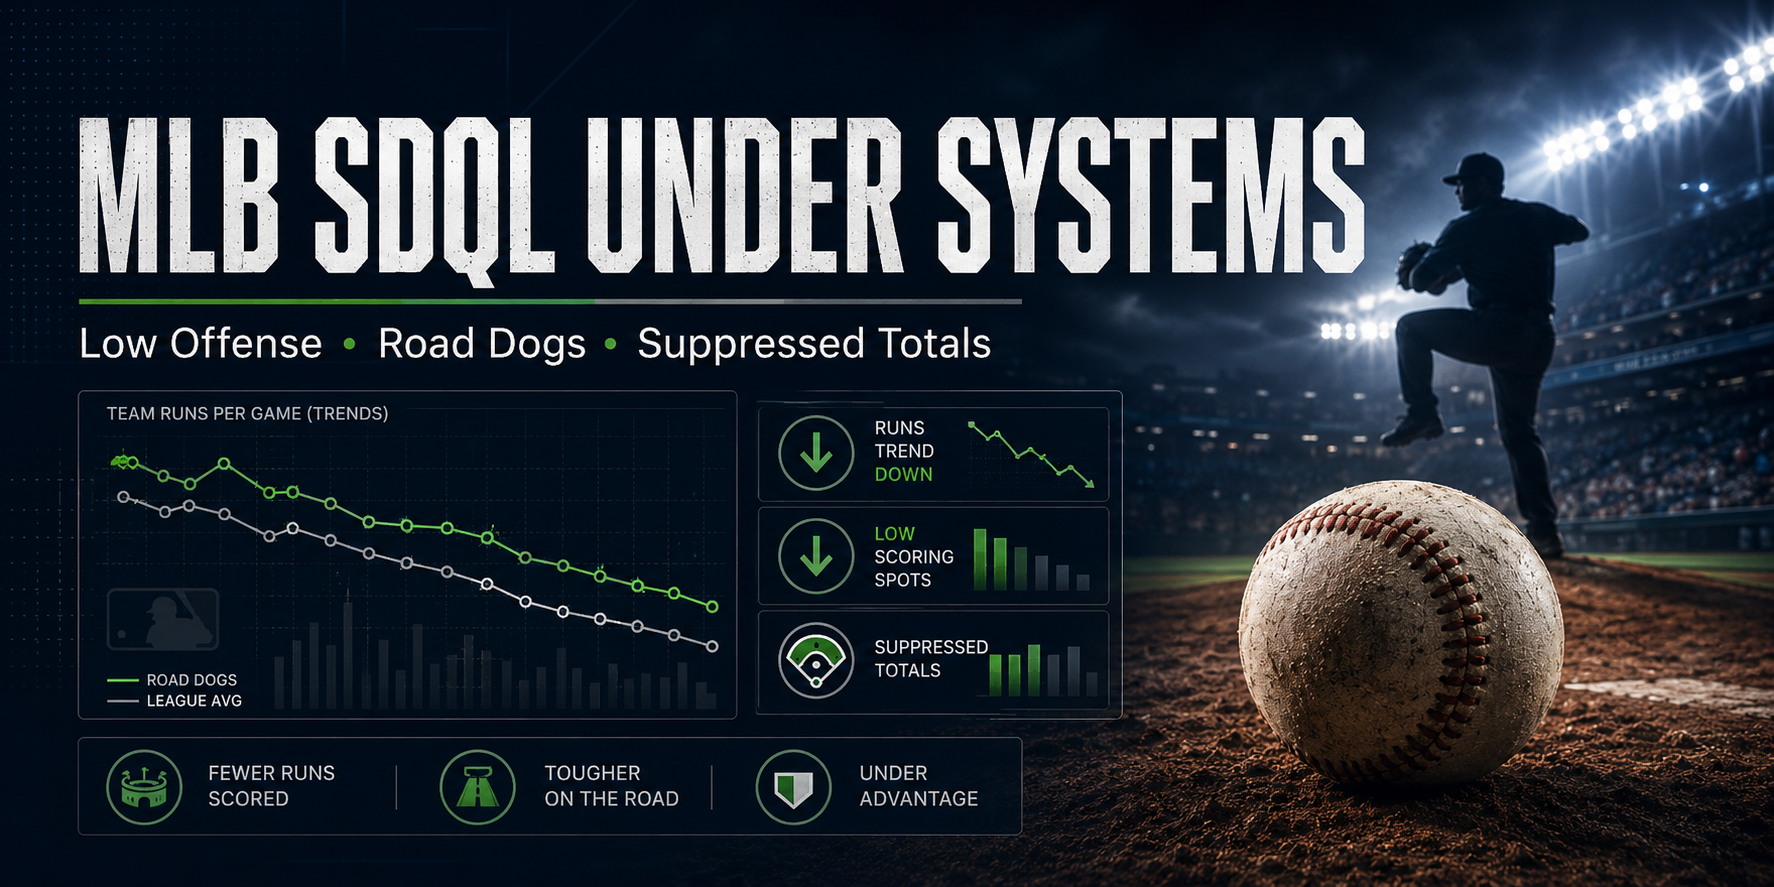
These MLB SDQL Under betting systems focus on games where recent offensive production, prior matchup conditions, road-team pricing, and earlier Under results point toward suppressed scoring. The goal is not to chase “hot” trends, but to document repeatable market conditions where historical totals pricing appears to have leaned too high.
What Do These MLB SDQL Under Betting Systems Measure?
These MLB SDQL Under betting systems measure situations where the market may still be pricing average run environments even though recent team context suggests lower scoring risk. Each trend isolates a different type of suppression signal: weak recent offense, prior bullpen control, road underdog context, or a previous game that already stayed Under.
The three systems covered here are:
| System | Main Signal | Best Market |
|---|---|---|
| Low hits + low recent scoring | Team offensive suppression | Under |
| Road dog after clean bullpen matchup | Road underdog / prior pitching control | Under |
| Low strikes thrown + prior Under | Previous low-scoring context | Under |
The common thread is not one stat by itself. It is the overlap between recent offensive limitation and market totals that may not fully adjust downward.
MLB SDQL Under System: Low Hits, Low Runs, and Short Series Context
This system looks at games since 2022 where the team had no more than 7 hits in the starter’s last matchup, scored fewer than 2 runs in its previous game, and is playing in a series of no more than 3 games.
SDQL Code
season>=2022 and S:hits<=7 and p:runs<2 and series games<=3
Plain-English Description
Take the Under when:
- The season is 2022 or later
- The team had no more than 7 hits in the starter’s last matchup
- The team scored fewer than 2 runs in its previous game
- The game is part of a series of no more than 3 games
This is a recent-form offensive suppression angle. It does not simply say “bad offense goes Under.” It narrows the setup to teams with limited recent hit production and limited run output in a shorter series environment.
Historical Results
| Market | Record | Avg Cover Margin | Win % | ROI | Profit | P-Value |
|---|---|---|---|---|---|---|
| SU | 457-487 | -0.0 | 48.4% | -5.0% / -2.5% | -$5,834 / -$3,128 | 0.17266637 |
| RL | 462-481-0 | -0.0 | 49.0% | -5.5% / -5.9% | -$6,656 / -$7,217 | 0.27896936 |
| OU | 385-522-37 | +0.1 | 42.4% Over | -18.4% / +10.0% | -$19,066 / +$10,331 | 0.00000304 |
Average Line: -104.9 / -118.8
Average Run Line: -111.8 / -111.8
Average Total: 8.2
Why This Under System Matters
The side and run line results are not the focus here. The value appears almost entirely on the total.
The OU record shows Overs went 385-522-37, which means the Under side went 522-385-37. Excluding pushes, that is roughly a 57.6% Under rate.
That is a strong result for a recent-sample Under system, especially with a reported +10.0% ROI on the Under side and a very low p-value.
The market logic is straightforward: when a team is coming off limited run production and has shown limited hit production in the relevant starter matchup context, the total may still be shaded too high if the market is pricing more toward season-level averages than recent offensive condition.
This does not mean every weak offensive team should be blindly bet Under. It means this specific overlap has historically produced Under value.
MLB SDQL Under System: Road Teams After Clean Bullpen Matchups as Prior Dogs
This system looks at road teams since 2017 whose bullpen allowed fewer than 1 run in the previous matchup, and who were underdogs of at least +120 in that prior matchup.
SDQL Code
season>=2017 and P:bullpen runs allowed<1 and A and P:line>=120.0
Plain-English Description
Take the Under when:
- The season is 2017 or later
- The team’s bullpen allowed fewer than 1 run in the previous matchup
- The team is on the road
- The team was at least a +120 underdog in the previous matchup
This is a more nuanced Under setup. It combines road-team pricing, prior underdog status, and recent bullpen run prevention.
Historical Results
| Market | Record | Avg Cover Margin | Win % | ROI | Profit | P-Value |
|---|---|---|---|---|---|---|
| SU | 816-1259 | -0.8 | 39.3% | -5.7% / -1.1% | -$12,148 / -$3,751 | 0.00000000 |
| RL | 1123-948-0 | +0.6 | 54.2% | -3.3% / -4.9% | -$9,446 / -$11,370 | 0.00006524 |
| OU | 880-1100-91 | +0.1 | 44.4% Over | -14.4% / +6.3% | -$32,856 / +$14,362 | 0.00000042 |
Average Line: +149.4 / -171.0
Average Run Line: -133.7 / +112.4
Average Total: 8.4
Why This Road Under System Matters
This is not a moneyline trend. The team side has performed poorly straight up, which makes sense given the average line profile. These are road teams in situations where they have often been priced as meaningful underdogs.
The total is the important piece.
The Over side went 880-1100-91, which translates to an Under-side record of 1100-880-91. Excluding pushes, that is roughly a 55.6% Under rate.
The market may be pricing these games with enough respect for favorite scoring potential, but the recent bullpen context suggests a more controlled run environment. If the road team’s bullpen recently limited damage, and the market still expects a normal or elevated scoring game, the Under can become the more attractive historical side.
The average total of 8.4 is also important. This is not limited to extremely low totals. The system has appeared in a more normal MLB totals range, which makes the Under result more interesting.
MLB SDQL Under System: Low Team Strikes Thrown and Prior Game Went Under
This system looks at games since 2017 where the team threw 77 or fewer strikes in the previous matchup, the previous game went Under, and the run line runs value is -1.5.
SDQL Code
season>=2017 and P:team strikes thrown<=77 and p:U and run line runs=-1.5
Plain-English Description
Take the Under when:
- The season is 2017 or later
- The team threw 77 or fewer strikes in its previous matchup
- The team’s previous game went Under the total
- The run line is set at -1.5
This system combines prior Under result context with a low team-strike threshold from the previous matchup. The signal is not that low strike volume automatically creates an Under. It is that this specific profile has historically aligned with suppressed total outcomes.
Historical Results
| Market | Record | Avg Cover Margin | Win % | ROI | Profit | P-Value |
|---|---|---|---|---|---|---|
| SU | 683-473 | +0.8 | 59.1% | +0.1% / -7.1% | +$89 / -$8,339 | 0.00000000 |
| RL | 512-644-0 | -1.0 | 44.3% | -3.6% / -7.3% | -$4,449 / -$12,389 | 0.00005745 |
| OU | 482-634-40 | +0.1 | 43.2% Over | -16.9% / +8.6% | -$21,556 / +$10,927 | 0.00000300 |
Average Line: -153.1 / +134.3
Average Run Line: +120.5 / -142.4
Average Total: 8.5
Why This Prior Under System Matters
This is another trend where the total is much cleaner than the side or run line.
The Over side went 482-634-40, meaning the Under side went 634-482-40. Excluding pushes, that is roughly a 56.8% Under rate.
The straight-up side won at 59.1%, but the ROI was essentially flat because the average line was expensive at -153.1. That is a useful reminder: winning percentage does not equal betting value.
The stronger edge came from the total, not the team side.
When a previous game already went Under, the market may still resist moving the next total down far enough, especially if the favorite profile remains attractive. This filter suggests that under certain strike-volume and pricing conditions, the lower-scoring environment has historically continued more often than the market expected.
Which MLB Under System Looks Strongest?
The strongest system depends on whether you prioritize sample size, ROI, or recency. All three systems point to the Under, but they do it through different market logic.
| Rank | System | Under Record | Under ROI | Best Use |
|---|---|---|---|---|
| 1 | Low hits + low recent runs | 522-385-37 | +10.0% | Best ROI and recent-form signal |
| 2 | Low strikes + prior Under | 634-482-40 | +8.6% | Strong prior-total continuation angle |
| 3 | Road team after clean bullpen matchup | 1100-880-91 | +6.3% | Largest sample and broadest market signal |
The first trend is the cleanest from an ROI perspective. It also has the most intuitive market logic: recent offensive limitation plus a total that may not fully account for suppression.
The second trend has a strong Under rate and a clear continuation profile after a prior Under.
The third trend has the largest sample size and the biggest Under-side profit, but the ROI is lower. That makes it useful as a broad screening condition rather than the most aggressive standalone signal.
What These MLB Under Trends Say About Totals Markets
These MLB Under trends suggest that totals markets can remain too high when recent scoring suppression is treated as noise instead of information. That does not mean the market is always wrong. It means certain combinations of recent offensive weakness, prior Under results, and bullpen context have historically mattered.
The strongest common signals are:
- Recent low run output
- Limited hit production
- Prior game stayed Under
- Bullpen recently limited damage
- Totals remained in the 8.2 to 8.5 average range
That last point is important. These are not only 6.5 or 7.0 totals where the market is already screaming pitching duel. The average totals were still in a playable MLB range, which suggests the market may have left room for Under value.
How Should Bettors Use These MLB SDQL Under Systems?
These MLB SDQL Under systems should be used as watchlist filters, not automatic betting instructions. The next step is always to compare the historical setup to the current market price.
Before playing an Under from one of these systems, check:
- Has the total already dropped?
- Is the current total still near the historical average range?
- Are the starting pitchers confirmed?
- Is the bullpen context still relevant today?
- Are key relievers available?
- Are wind, weather, roof, and park factors aligned?
- Is the umpire profile neutral or Under-friendly?
- Did the market move because of real information or public reaction?
Price sensitivity matters. A system that performed well at an average total of 8.5 may not hold the same value if the current market has already moved down to 7.5.
That is why SDQL research works best as a process layer. It helps identify games worth evaluating more closely, but the final decision still depends on number quality.
Key Takeaways From These MLB Under Betting Systems
These three SDQL systems all point toward the same broader conclusion: MLB totals markets can overprice offense when recent suppression signals are specific enough.
The major takeaways are:
- The strongest ROI came from the low hits + low recent runs Under system.
- The largest sample came from the road-team bullpen context Under system.
- The prior Under + low strikes system showed strong continuation value.
- Side results were mixed and should not be treated as the main signal.
- The Under results were the clearest and most consistent across all three systems.
The purpose of these systems is not to predict every individual game. The purpose is to identify historically profitable market conditions and then apply discipline, line shopping, and current-day confirmation.
How This Fits Into the Market
Sports Betting Market Mechanics
A broader explanation of how pricing, line movement, public perception, and market timing shape betting value.
Public Bias and Market Distortion
Why obvious narratives can distort betting markets, especially when bettors overreact to scoring, team strength, or recent results.
What Sports Betting Systems Really Measure
A deeper look at why systems should be treated as structured market filters, not guaranteed predictions.
Process & Proof
Documented Betting Results
Long-term documentation matters more than isolated trend wins, short-term streaks, or one-day betting results.
Raw Numbers
Daily market data and betting numbers help turn historical systems into a more disciplined evaluation process.
Related MLB Analysis
MLB Trends
A central hub for MLB betting trends, market research, and historical system analysis.
MLB Team Trends
Team-specific MLB trend research for bettors studying historical conditions beyond basic standings and recent form.
What Are Good General Backtesting Filters?
A practical guide to sample size, p-values, ROI, and avoiding misleading historical betting systems.
This is a smart way to frame MLB Unders. The start time alone is not enough, but paired with other filters it becomes much more useful.
Helpful article. Early starts are easy to overlook, but they can matter when combined with the right totals setup.
Low-offense totals angles make sense in MLB because the market can overreact to recent scoring while missing the underlying run environment.