
WNBA Under Betting Trends: When Low-Possession Profiles Matter
WNBA Under betting trends can help identify totals situations where the market may have expected too much scoring. The strongest Under systems are usually not built on final scores alone. They often involve possession volume, shot attempts, rebounding, lead changes, rest, defensive context, and whether the posted total fully reflects the likely scoring environment.
This article is part of the broader WNBA Betting Trends research library, covering historical ATS systems, totals systems, SDQL filters, and market-based WNBA betting analysis.
WNBA Under Betting Trends Results Snapshot
These WNBA Under systems are historical totals signals, not automatic betting instructions. The strongest public examples combine meaningful sample size, positive units, reasonable ROI, and a logical connection to pace, possessions, or scoring restraint.
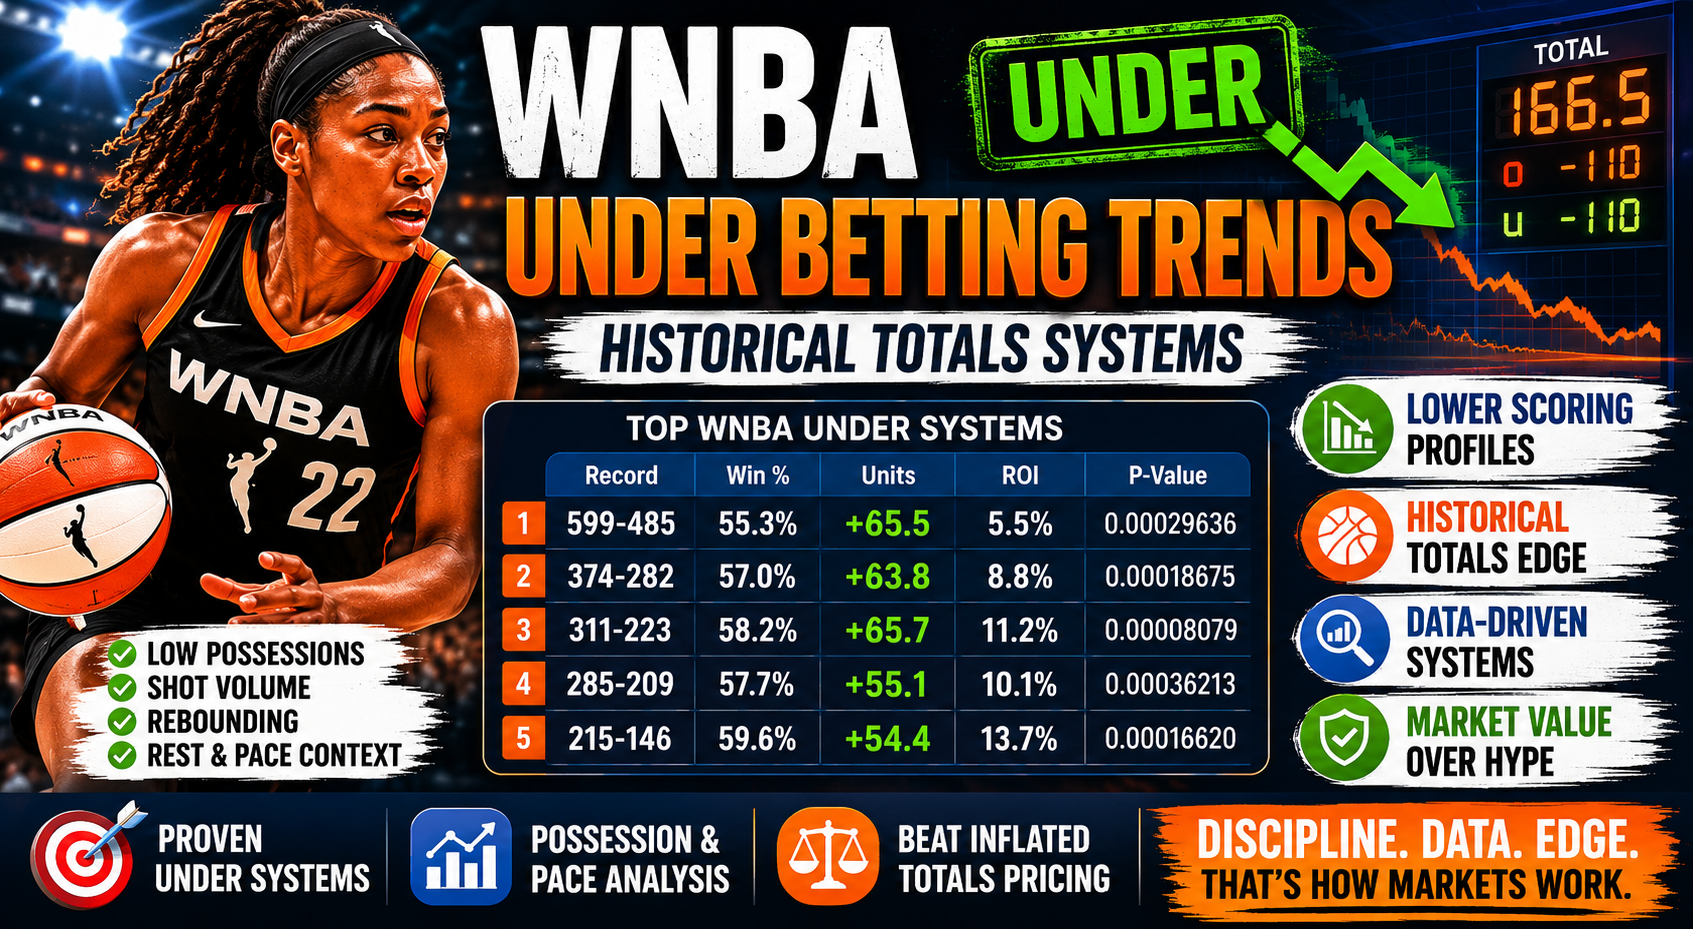
| Market | Play | Record | Win % | Units | ROI | P-Value | System Theme |
|---|---|---|---|---|---|---|---|
| O/U | UNDER | 599-485 | 55.3% | +65.5 | 5.5% | 0.00029636 | Large-sample regular-season Under profile with rebounding and block context |
| O/U | UNDER | 374-282 | 57.0% | +63.8 | 8.8% | 0.00018675 | Lower-total Eastern Conference games with stable prior game flow |
| O/U | UNDER | 311-223 | 58.2% | +65.7 | 11.2% | 0.00008079 | Underdog profile after low shot volume and low rebounding |
| O/U | UNDER | 285-209 | 57.7% | +55.1 | 10.1% | 0.00036213 | Short-rest Under profile with lead-change and conference context |
| O/U | UNDER | 215-146 | 59.6% | +54.4 | 13.7% | 0.00016620 | Higher-total setup with opponent rest and halftime margin context |
Full SDQL References
For transparency, here are the full SDQL filters behind the systems above:
P:offensive rebounds<7 and playoffs=0 and po:blocks>2P:lead changes<=10 and total<176.5 and conference=Easternp:field goals attempted<=62 and D and p:rebounds<=33P:lead changes<10 and rest<=2 and o:conference=Easternp:total>=171.5 and o:rest<3 and tA(margin at the half)>-3.0
What Are WNBA Under Betting Trends?
WNBA Under betting trends are historical systems that study when games finished below the posted total. The goal is not to assume low-scoring games will always stay low. The goal is to identify situations where the market may have set the total too high.
Totals betting is different from spread betting.
A team can play well and still produce an Under. A favorite can cover while the game stays Under. An underdog can cover in a slow, ugly game. The total is not about who wins. It is about the scoring environment.
That scoring environment is shaped by possessions, field goal attempts, rebounds, turnovers, free throws, pace, rest, lineup context, and game flow.
That is why the best WNBA Under systems usually focus on measurable basketball conditions instead of vague ideas like “defensive team” or “low-scoring matchup.”
Why WNBA Under Trends Deserve Separate Study
WNBA Under trends deserve separate study because totals markets can misread pace and possession volume. A final score tells us what happened, but shot attempts, rebounds, lead changes, and rest can help explain why it happened.
That distinction matters.
The market often reacts to final scores. If a game flies Over, the next total may adjust upward. If a team looks efficient offensively, the market may expect that scoring to continue. But sometimes the underlying possession profile does not support the new number.
WNBA totals can also be sensitive to smaller pieces of information. A few possessions, a slower pace, fewer offensive rebounds, or limited shot volume can be enough to push a game below the posted total.
That is why Under systems can be useful.
They help identify when the market may be pricing scoring expectations too aggressively.
The Largest-Sample WNBA Under System
One of the strongest public-facing Under systems in this group is:
P:offensive rebounds<7 and playoffs=0 and po:blocks>2
This system went 599-485 to the Under, producing +65.5 units.
The ROI is lower than some smaller trends, but the sample size is extremely useful. For public website content, that matters. A 599-485 result is not as flashy as a small 12-0 trend, but it is much more credible as a long-term market signal.
In plain English, this system focuses on regular-season games involving prior offensive rebounding and prior opponent block context.
That combination makes sense for an Under profile.
Offensive rebounds create second chances. Second chances create extra shots, extra fouls, and extra scoring opportunities. When a prior profile includes fewer offensive rebounds, the scoring environment may be more limited than the market expects.
The system does not say offensive rebounds alone predict the next total.
It says that this broader historical profile has leaned Under across a very large sample.
Why Field Goal Attempts Matter for WNBA Unders
Field goal attempts are one of the most important variables in totals research because they help measure possession volume. A team that is not generating many shots may struggle to help a game reach the posted total.
One of the cleaner Under systems in the database is:
p:field goals attempted<=62 and D and p:rebounds<=33
This system went 311-223 to the Under, producing +65.7 units with an 11.2% ROI.
In plain English, this system looks at underdogs coming off a game with no more than 62 field goal attempts and no more than 33 rebounds.
That is a logical Under profile.
Low shot volume can point toward slower pace, weaker offensive pressure, or fewer possessions. Low rebounding can point toward fewer second-chance opportunities or less control of the possession environment. When that profile belongs to an underdog, the scoring burden may be even harder to support.
The market may still set a total based on team averages, recent scores, or opponent perception.
But the underlying possession profile may point lower.
Why Rebounding Matters in WNBA Under Systems
Rebounding matters because it controls how possessions end. Offensive rebounds extend possessions. Defensive rebounds end them. A totals market that misreads rebounding context may misprice the number.
For Under betting, limited offensive rebounding is especially important.
A team can miss shots and still push a game Over if it keeps creating second chances. But when offensive rebounding is limited, missed shots are more likely to end possessions. That can reduce shot volume, free throw chances, and late-clock scoring opportunities.
The large-sample system:
P:offensive rebounds<7 and playoffs=0 and po:blocks>2
is a good example of why rebounding context matters.
It does not simply say “bad offense goes Under.” It focuses on a specific possession-extension profile. That is more useful than looking only at final scores.
The Under often comes from missing possessions the market expected to exist.
Rebounding helps reveal whether those extra possessions are likely.
Why Lead Changes Can Signal Lower-Scoring Game Flow
Lead changes are not usually the first statistic bettors think about, but they can be useful in totals research. A game with fewer lead changes may have had a more stable structure, less back-and-forth volatility, or more predictable game flow.
One strong Under system is:
P:lead changes<=10 and total<176.5 and conference=Eastern
This system went 374-282 to the Under, producing +63.8 units with an 8.8% ROI.
This system is interesting because the posted total is already below 176.5. That means the market was not expecting a track meet. Yet this historical profile still leaned Under.
That suggests the market may not have gone low enough in certain Eastern Conference totals situations with stable prior game flow.
Another related system is:
P:lead changes<10 and rest<=2 and o:conference=Eastern
This system went 285-209 to the Under, producing +55.1 units.
Again, the lead-change filter may be capturing game-flow stability. When paired with short rest and conference context, it has historically identified Under value.
Lead changes do not predict totals by themselves.
But as part of a system, they can help describe the type of game environment the market may be mispricing.
Why Rest Can Matter for WNBA Under Trends
Rest matters in totals betting because tired teams may be less efficient offensively, less sharp in transition, and more likely to play slower. Rest can also affect shooting legs, late-game execution, and defensive consistency.
One Under system from the database is:
p:total>=171.5 and o:rest<3 and tA(margin at the half)>-3.0
This system went 215-146 to the Under, producing +54.4 units with a 13.7% ROI.
This is a useful system because it applies to higher-total games. A total of 171.5 or higher means the market expects a relatively strong scoring environment. But the system adds opponent rest and halftime-margin context, suggesting that the game may not be as open as the number implies.
The value of this trend is not just that it went Under.
The value is that it shows how a higher total can still be too high when the surrounding game context does not support the scoring expectation.
That is an important lesson.
Unders are not only for low totals.
Sometimes the best Under value appears when the market pushes a total upward too far.
Why Higher Totals Can Still Produce Under Value
Many bettors assume lower totals are better Under candidates and higher totals are better Over candidates. That is too simple.
A high total can create Under value if the market has overestimated pace, efficiency, shot volume, or scoring continuation. In fact, higher totals can sometimes offer more room for the market to be wrong.
The system:
p:total>=171.5 and o:rest<3 and tA(margin at the half)>-3.0
is a good example.
The total threshold means the market was already pricing a stronger scoring environment. But the historical results still leaned Under. That suggests the number may have been inflated relative to the actual game profile.
This is why totals betting must always be price-sensitive.
The question is not whether the total looks high or low.
The question is whether it is high or low relative to the true scoring environment.
Why WNBA Under Trends Are Not Blind Picks
WNBA Under trends should not be treated as automatic bets. Totals are extremely sensitive to price, and a strong historical system can lose value after the market moves.
An Under may be attractive at 174.5 but not at 170.5. The same system may still qualify, but the edge can disappear once the number drops.
This is especially important in smaller markets where totals can move quickly after injury updates, lineup information, or sharper betting activity.
Important questions include:
- What is the current total?
- Has the total already moved down?
- Does the current number still match the system logic?
- Are injuries affecting pace or efficiency?
- Is the market reacting to recent scoring too aggressively?
- Is the Under still playable at the available price?
The system identifies the situation.
The number determines whether value still exists.
How to Use WNBA Under Betting Trends Responsibly
WNBA Under betting trends are best used as research filters. They can point toward games where the total may be too high, but they should still be checked against current market conditions.
A disciplined process looks like this:
- Identify whether the game qualifies for a historical Under system.
- Review the current total.
- Compare the number to the system’s historical logic.
- Check injuries, rest, pace, and lineup context.
- Review recent field goal attempts and rebounding.
- Check whether the market has already moved downward.
- Avoid forcing the bet if the best number is gone.
The goal is not to bet every Under trend.
The goal is to understand when the market may be overestimating scoring.
That is the difference between using trends as research and using trends as shortcuts.
What Makes a WNBA Under Trend Website-Worthy?
A WNBA Under trend is website-worthy when it explains a clear totals concept. The best public-facing trends should not just have strong records. They should help readers understand why the market may have missed the scoring environment.
The strongest Under examples usually involve:
- Meaningful sample size
- Positive units
- Reasonable ROI
- Low p-value
- Clear Under direction
- Possession-volume logic
- Rebounding or shot-volume context
- A simple enough explanation for readers to understand
That is why systems like 599-485 Under, 374-282 Under, 311-223 Under, and 285-209 Under are useful public examples.
They are not perfect.
But they are credible, explainable, and aligned with a disciplined market-research approach.
WNBA Under Betting Trends FAQ
What are WNBA Under betting trends?
WNBA Under betting trends are historical systems that study when games finished below the posted total in specific market, team, or statistical situations.
What does Under mean in WNBA betting?
An Under bet wins when the combined final score of both teams is lower than the posted total. If the total is 166.5, the game must finish with 166 or fewer combined points.
Are WNBA Under trends profitable?
Some historical WNBA Under systems have produced profitable results, including large-sample systems with positive units and ROI. That does not mean future qualifying games should be bet blindly.
Why do field goal attempts matter for WNBA Unders?
Field goal attempts help measure shot volume and possession pace. Lower shot volume can make it harder for a game to reach the posted total.
Why do rebounds matter for Under betting?
Rebounds affect possession length. Offensive rebounds create second chances, while limited offensive rebounding can reduce extra scoring opportunities and support Under profiles.
Should I bet every WNBA Under system?
No. WNBA Under systems should be used as research signals. The current total, line movement, injuries, pace, rest, and market timing still matter.
How This Fits Into the Market
Sports Betting Market Mechanics
Understand how totals, line movement, pricing, and market timing shape betting value.
Public Bias and Market Distortion
Learn how public perception and recent scoring narratives can distort betting markets.
What Sports Betting Systems Really Measure
See why historical systems should be treated as market signals, not guaranteed predictions.
Process & Proof
Historical Performance
Review long-term Raw Numbers and official daily email performance tracking.
Raw Numbers
Access daily Raw Numbers and market-based projections by sport.
Related WNBA Betting Research
WNBA Betting Trends
Start with the main WNBA betting trends hub covering ATS systems, totals systems, SDQL research, and market-based analysis.
WNBA Over/Under Trends
Study broader WNBA totals systems, including both Over and Under results tied to pace, rebounds, and scoring environment.
WNBA Over Betting Trends
Review Over-focused WNBA totals systems tied to shot volume, rebounding context, scoring pressure, and market under-adjustment.
WNBA Rebounding & Shot Volume Trends
See how rebounds, field goal attempts, three-point volume, and possession structure connect to WNBA totals pricing.