
WNBA ATS Trends: Road Teams, Underdogs, and Market Pricing
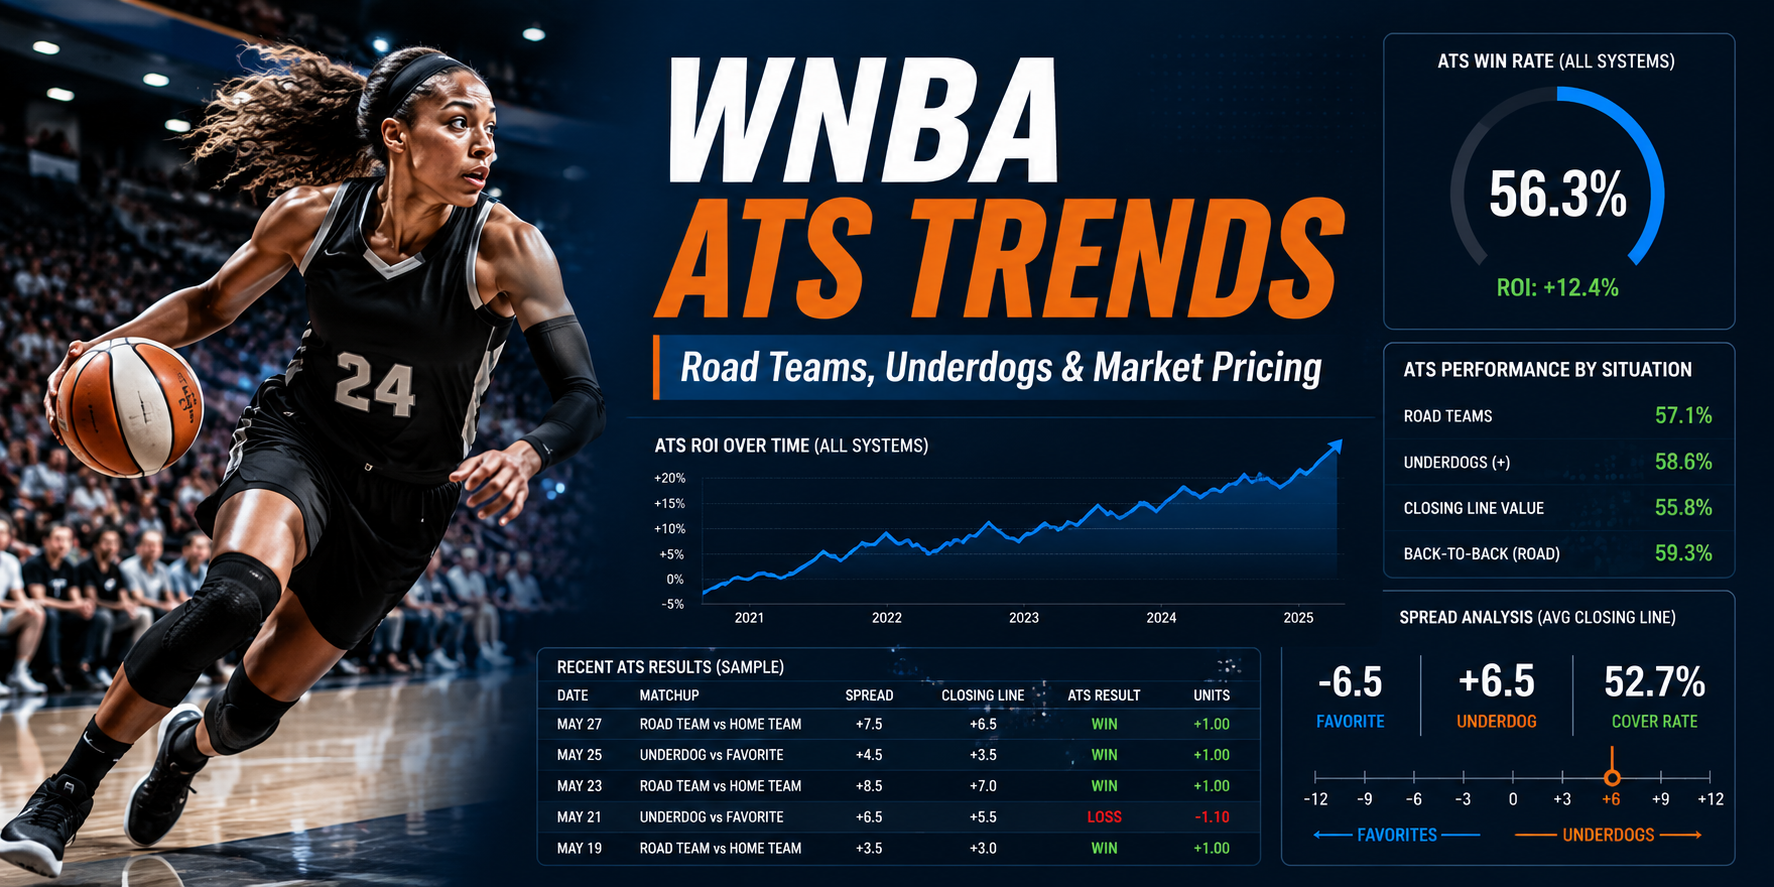
WNBA ATS trends can reveal how the betting market has historically priced road teams, underdogs, and lower-profile situations against the spread. The goal is not to turn every trend into a blind pick. The goal is to study where historical spread results suggest that the market may have consistently mispriced certain team situations.
This article is part of the broader WNBA Betting Trends research library, covering historical ATS systems, totals systems, SDQL filters, and market-based WNBA betting analysis.
WNBA ATS Trends Results Snapshot
The strongest WNBA ATS trends in this research are not just short-sample win-rate spikes. The most useful systems combine larger sample size, positive units, reasonable ROI, and a clear market explanation.
| Market | Play | Record | Win % | Units | ROI | P-Value | SDQL |
|---|---|---|---|---|---|---|---|
| ATS | ON | 464-335 | 58.1% | +95.5 | 10.9% | 0.00000285 | season>=2017 and op:blocks<=3 and A and tA(points)<87.0 |
| ATS | ON | 502-387 | 56.5% | +76.3 | 7.8% | 0.00006452 | season>=2017 and p:ats margin>=-22.0 and A and op:blocks<=3 |
| ATS | ON | 399-297 | 57.3% | +72.3 | 9.4% | 0.00006288 | site=away and p:line>=-5.5 and tournament=0 |
| ATS | ON | 305-220 | 58.1% | +63.0 | 10.9% | 0.00011975 | streak<=2 and line>=5.5 and tournament=0 |
| ATS | ON | 298-219 | 57.6% | +57.1 | 10.0% | 0.00029485 | P:three pointers attempted<32 and line>=5.5 and tournament=0 |
| ATS | ON | 205-135 | 60.3% | +56.5 | 15.1% | 0.00008703 | season>=2022 and p:rebounds>=31 and line>=1.5 and op:pace>=81.6 |
| ATS | ON | 286-213 | 57.3% | +51.7 | 9.4% | 0.00062306 | season>=2017 and P:fouls<20 and A and tournament=0 |
| ATS | ON | 297-222 | 57.2% | +52.8 | 9.2% | 0.00057073 | season>=2022 and streak<=1 and A and P:dps>=-4.0 |
These systems are best understood as historical market signals. They do not mean every future qualifying WNBA team should be bet automatically.
What Are WNBA ATS Trends?
WNBA ATS trends measure how teams have performed against the point spread in specific historical situations. A team can lose the game outright and still cover the spread if the market price was too high.
That is why ATS research is different from simply asking which team is better. Against-the-spread results are about price. A mediocre team can be valuable if the market underrates it. A strong team can be dangerous if the market overprices it.
This is especially important in WNBA betting because the market can be thinner, less discussed, and less heavily analyzed than major men’s sports markets. When fewer people are studying the details, pricing patterns can be easier to overlook.
The best WNBA ATS trends usually ask questions like:
- Are road teams being discounted too heavily?
- Are underdogs getting too many points in specific situations?
- Is the market overreacting to recent scoring or shooting results?
- Do lower-profile teams perform better ATS than public perception suggests?
- Does the spread adjust slowly to rebounding, pace, fouls, or defensive indicators?
Those are market questions, not prediction questions.
Why Road Teams Show Up So Often in WNBA ATS Trends
Road teams appear repeatedly in the strongest WNBA ATS systems from this database. That does not mean every road team is valuable, but it does suggest that road pricing deserves serious attention.
The biggest ATS system in this group is:
season>=2017 and op:blocks<=3 and A and tA(points)<87.0
This system went 464-335 ATS, producing +95.5 units with a 10.9% ROI.
In plain English, this looks at road teams averaging fewer than 87 points per game when their opponent had no more than three blocks in its previous game.
That may sound specific, but the larger idea is easier to understand: the system is isolating road teams with lower scoring profiles against opponents coming off a modest defensive interior-impact indicator. These are not necessarily glamorous teams. They may not be public-friendly. But historically, this profile has covered at a strong rate.
That is exactly the kind of WNBA ATS trend worth studying.
Not because it is flashy.
Because it combines a large sample, strong units, and a logical market concept.
WNBA Road Team ATS Trend Example
A cleaner road-team angle from the database is:
site=away and p:line>=-5.5 and tournament=0
This system went 399-297 ATS, producing +72.3 units with a 9.4% ROI.
This trend is useful because it is easier to explain. It focuses on regular-season road teams whose previous line was not an extreme favorite profile. In other words, it avoids some of the more unusual tournament or high-expectation settings and instead captures ordinary WNBA road-team pricing.
That makes it more useful for a public-facing article.
The trend suggests that the market may have historically undervalued certain road teams that were not coming from heavily inflated prior expectations. This is the kind of angle that fits a market-based betting process because it is less about team reputation and more about how the spread is being set.
A road team does not have to be great to be undervalued.
It only has to be priced too low.
What WNBA Underdog Trends Reveal About Spread Pricing
WNBA underdog trends are useful because underdogs often sit at the intersection of price, perception, and market discomfort. Many bettors prefer favorites because favorites feel safer. That preference can leave value on the other side.
One of the strongest underdog systems in the database is:
streak<=2 and line>=5.5 and tournament=0
This system went 305-220 ATS, producing +63.0 units with a 10.9% ROI.
In plain English, this looks at regular-season teams catching at least 5.5 points when their current streak is no more than two. That does not mean “bet bad teams blindly.” It means this historical profile has identified a class of underdogs that the market may have priced too pessimistically.
Another supporting underdog system is:
P:three pointers attempted<32 and line>=5.5 and tournament=0
This system went 298-219 ATS, producing +57.1 units with a 10.0% ROI.
This one adds a previous-game shot profile. It focuses on teams catching at least 5.5 points after attempting fewer than 32 three-pointers in the previous matchup. That may reflect a style or pace profile that the market does not always price correctly.
The important lesson is not that WNBA underdogs are always good.
The lesson is that certain underdog profiles have historically covered more often than the market implied.
Why Lower-Profile Teams Can Create ATS Value
Some of the best ATS spots are not attached to the most popular teams or the most obvious narratives. They often come from situations where a team looks ordinary, limited, or unattractive to casual bettors.
That matters because betting markets are influenced by perception.
If a team is lower-scoring, on the road, catching points, or coming off a quiet statistical game, casual bettors may avoid it. Sportsbooks and market makers know this. The spread can reflect not only team strength, but also the public’s willingness or unwillingness to back that side.
A trend like:
season>=2017 and p:ats margin>=-22.0 and A and op:blocks<=3
went 502-387 ATS, producing +76.3 units.
This is another road-team system tied to prior ATS margin and opponent defensive context. It is not built around star players or media attention. It is built around conditions that may affect how the market prices the next game.
That is the point of WNBA ATS research.
The strongest angles often appear where the market is less emotionally comfortable.
Why These Are Not Blind WNBA ATS Picks
These WNBA ATS trends should not be read as automatic picks. A historical system is a research signal, not a guarantee.
Even a strong trend can fail for several reasons:
- The current line may already be adjusted.
- Injury information may change the true price.
- The market may have corrected the inefficiency.
- The system may be capturing past conditions that no longer apply.
- A trend may be profitable historically but fragile going forward.
That is why the best use of ATS systems is not blind betting. The best use is structured filtering.
A system can tell you where to look. It cannot replace the current number.
That distinction is critical. Betting against the spread is always price-sensitive. A team that qualifies at +6.5 may not offer the same value at +4.5. A road underdog profile may be historically profitable, but if the market has already moved, the edge may be gone.
This is where market timing and closing line value matter.
How to Use WNBA ATS Trends Responsibly
WNBA ATS trends should be used as part of a broader decision process. They are most useful when paired with current line value, injury context, matchup notes, and market movement.
A practical process would look like this:
- Identify whether a game qualifies for a historical ATS system.
- Review the current spread and compare it to the likely fair range.
- Check whether the line has already moved.
- Review injury and lineup context.
- Determine whether the system still has price value.
- Track the closing line to evaluate process over time.
The goal is not to bet more games.
The goal is to make the research more disciplined.
That is why the largest ATS trends are more useful than the most dramatic tiny-sample records. A 36-4 system may be interesting, but a 464-335 or 502-387 system is usually more credible for public analysis because it has been tested across far more games.
For website trust, larger-sample trends are better than hype.
What Makes a WNBA ATS Trend Website-Worthy?
A WNBA ATS trend is website-worthy when it helps explain a market concept clearly. The trend should not just look profitable. It should teach the reader something about how spreads are priced.
For this article, the strongest themes are:
- Road teams appearing repeatedly in profitable ATS systems
- Underdogs catching 5.5 or more showing meaningful historical results
- Lower-scoring or less public-friendly teams still producing spread value
- Previous-game indicators such as blocks, fouls, rebounds, and shot attempts showing up in useful filters
- Regular-season filtering helping remove unusual tournament conditions
Those themes support the broader ProComputerGambler positioning.
This is not about “tonight’s best pick.”
This is about studying how the market has historically valued WNBA teams in specific ATS situations.
WNBA ATS Trends FAQ
What does ATS mean in WNBA betting?
ATS means against the spread. A team covers ATS when it performs better than the betting line required. Favorites need to win by more than the spread, while underdogs can cover by losing by less than the spread or winning outright.
Are WNBA ATS trends profitable?
Some historical WNBA ATS trends have produced profitable results, including large-sample systems with positive units and ROI. That does not mean every future qualifier should be bet blindly.
Why do road teams show up in WNBA ATS systems?
Road teams can be less attractive to casual bettors, especially when they have lower scoring profiles or weaker public perception. That can create spread value when the market discounts them too aggressively.
Are WNBA underdogs better than favorites ATS?
Not always. The database does show several profitable underdog profiles, but the value depends on the exact conditions, line, timing, and market context.
Should WNBA ATS systems be used as picks?
No. WNBA ATS systems should be treated as historical research signals. They can identify situations worth studying, but the current spread and market price still matter.
How This Fits Into the Market
Sports Betting Market Mechanics
Understand how line movement, spread pricing, market timing, and public behavior shape betting value.
Public Bias and Market Distortion
Learn how public perception can create pricing errors across betting markets.
What Sports Betting Systems Really Measure
See why betting systems should be viewed as market signals rather than prediction machines.
Process & Proof
Historical Performance
Review long-term Raw Numbers and official daily email performance tracking.
Raw Numbers
Access daily Raw Numbers and market-based projections by sport.
Related WNBA Betting Research
WNBA Betting Trends
Start with the main WNBA betting trends hub covering ATS systems, totals systems, SDQL research, and market-based analysis.
WNBA Road Team ATS Trends
Study why away-team pricing matters in WNBA spread markets and how road teams have performed in historical ATS systems.
WNBA Underdog Betting Trends
Review WNBA underdog systems focused on positive-line value, market discomfort, and historical ATS performance.
WNBA Spread Betting Trends
Go deeper into point-spread ranges, line value, and why the number matters more than the team label.
I like the point that underdogs are not automatically value, but the right underdogs can be mispriced
The edge is not just taking plus points. It is identifying when the spread gives too much credit to the favorite
This makes sense because WNBA lines can move a lot on perception without much volume behind them
That’s a big part of it. Smaller markets can react harder to limited action, which makes disciplined pricing even more important
Road underdogs in the WNBA seem like a good example of price being more important than team quality
Exactly. The team can still be weaker overall, but if the market overprices home court or recent form, the road underdog can still hold value